





Portfolios
Add to New Portfolio


Top MMO Coins by Market Cap
The MMO market cap today is $35.1 Million, a 1.3% change in the last 24 hours.
Read More about MMO
Online games that host large numbers of players.
Highlights
Category Overview
9 months ago
$35,147,138
Market Cap
1.3%

$11,882,299
24h Trading Volume

🔥 Trending
No trending coins available at this moment.
| # | Coin | Price | 1h | 24h | 7d | 30d | 24h Volume | Market Cap | FDV | Market Cap / FDV | Last 7 Days | ||
|---|---|---|---|---|---|---|---|---|---|---|---|---|---|
| 1015 |

Big Time
BIGTIME
|
$0.003938 | 0.3% | 2.0% | 7.8% | 39.7% | $7,855,088 | $11,539,116 | $19,692,144 | 0.5859756148812412 |

|
||
| 1321 |

World of Dypians
WOD
|
$0.01054 | 3.4% | 6.8% | 3.2% | 3.3% | $1,225,253 | $6,854,848 | $10,534,028 | 0.650733779386334 |

|
||
| 1381 |

Alien Worlds
TLM
|
$0.0008862 | 0.2% | 0.3% | 1.9% | 29.1% | $2,686,138 | $6,284,542 | $6,329,667 | 0.9928708742958309 |

|
||
| 2027 |

Star Atlas
ATLAS
|
$0.00009035 | 0.9% | 1.0% | 10.5% | 31.9% | $19,208.95 | $2,397,743 | $3,252,461 | 0.73720882005115 |

|
||
| 2257 |

Star Atlas DAO
POLIS
|
$0.006431 | 3.3% | 10.8% | 20.1% | 36.5% | $15,496.93 | $1,774,594 | $2,314,929 | 0.7665868706069444 |

|
||
| 2730 |

Cornucopias
COPI
|
$0.001024 | 0.2% | 8.4% | 1.0% | 26.8% | $161.57 | $1,057,313 | $3,932,347 | 0.26887570260416666 |

|
||
| 2734 |

Wrapped NCG
WNCG
|
$0.002427 | 0.0% | 1.1% | 22.6% | 38.6% | $2,142.93 | $1,054,972 | $1,054,972 | 1.0 |

|
||
| 3208 |

Guild of Guardians
GOG
|
$0.0007059 | 0.0% | 0.3% | 6.9% | 28.8% | $335.11 | $634,695 | $705,929 | 0.8990923392990001 |

|
||
| 3369 |

Draggin Karma Points
DKP
|
$0.0001352 | 0.2% | 4.4% | 8.6% | 24.5% | $18.92 | $540,045 | $1,082,507 | 0.4988838804486668 |

|
||
| 3716 |

RavenQuest
QUEST
|
$0.0007935 | 0.0% | 1.1% | 5.3% | 14.4% | $1,236.85 | $393,785 | $793,458 | 0.49629009006337 |

|
||
| 3838 |

Vulcan Forged
PYR
|
$0.01151 | 0.7% | 6.8% | 10.9% | 76.9% | $110,302 | $352,075 | $573,439 | 0.6139718897840459 |

|
||
| 4013 |

END
END
|
$0.002319 | 0.0% | 0.9% | 4.7% | 27.7% | $476.45 | $305,848 | $1,159,404 | 0.2637975372025 |

|
||
| 4024 |

XAYA
WCHI
|
$0.005202 | 0.2% | 3.0% | 6.9% | 32.7% | $1,494.72 | $302,934 | $402,200 | 0.753192301395484 |

|
||
| 4338 |

Moonsama
SAMA
|
$0.0002378 | 0.0% | 14.2% | 14.2% | 31.9% | $0.9825 | $237,816 | $237,816 | 1.0 |

|
||
| 4359 |

Binamon
BMON
|
$0.001376 | 0.1% | 1.2% | 0.9% | 16.2% | $511.98 | $234,202 | $314,600 | 0.7444449598928815 |

|
||
| 4467 |

PLAYA3ULL GAMES
3ULL
|
$0.00001366 | 0.0% | 1.2% | 6.9% | 47.2% | $10,111.08 | $212,674 | $212,674 | 1.0 |

|
||
| 4839 |

Kindra by virtuals
KINDRA
|
$0.0001613 | 0.1% | 0.2% | 37.2% | 60.1% | $204.20 | $161,257 | $161,257 | 1.0 |

|
||
| 5062 |

MCH Coin
MCHC
|
$0.002905 | 0.1% | 2.0% | 5.7% | 27.4% | $60.39 | $142,274 | $145,275 | 0.97934226 |

|
||
| 5085 |

Sekuya Multiverse
SKYA
|
$0.0002589 | 0.0% | 2.6% | 10.1% | 20.0% | $27,491.17 | $140,106 | $153,050 | 0.915427620512838 |

|
||
| 5120 |

MetaCene
MAK
|
$0.0002030 | 0.0% | 0.0% | 1.7% | 33.2% | $765.46 | $136,808 | $202,958 | 0.6740714434866827 |

|
||
| 5197 |

Domi
DOMI
|
$0.0002612 | 0.0% | 22.5% | 3.5% | 12.1% | $2,410.35 | $130,610 | $261,220 | 0.49999999999997524 |

|
||
| 5328 |

Bezoge Earth
BEZOGE
|
$0.0112999 | 0.0% | 1.9% | 15.3% | 23.8% | $50.56 | $118,586 | $299,924 | 0.3953885465950825 |

|
||
| 5749 |

MON Protocol
MON
|
Buy
|
$0.0001434 | 0.0% | 9.9% | 39.9% | 31.6% | $1.44 | $92,778.41 | $92,778.41 | 0.9999999998866538 |

|
|
| 6456 |

Avarik Saga
AVRK
|
$0.0003151 | 0.0% | 7.3% | 2.7% | 26.5% | $251.43 | $60,258.08 | $157,544 | 0.38248326 |

|
||
| 6580 |

Mossvale
MOSS
|
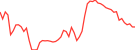
$0.00005812 | 1.2% | 6.8% | 40.3% | 74.9% | $1,395.13 | $56,604.54 | $56,604.54 | 1.0 |
|
||
| 6803 |

HermesWorld
HERMESWORLD
|
$0.00004947 | 1.5% | 0.9% | 5.9% | 51.1% | $118.66 | $49,466.21 | $49,466.21 | 1.0 |

|
||
| 7161 |

Blink Galaxy
GQ
|
$0.054844 | 0.0% | 0.0% | 0.1% | 0.0% | $4,915.25 | $40,737.47 | $41,208.11 | 0.9885790602641612 |

|
||
| 7366 |

MetaDOS
SECOND
|
$0.053784 | 0.0% | 0.2% | 0.7% | 1.7% | $31.44 | $37,345.61 | $37,835.37 | 0.9870553682369586 |

|
||
| 7748 |

Apeiron
APRS
|
$0.0001274 | 0.0% | 1.5% | 22.9% | 47.2% | $5.01 | $31,159.41 | $127,400 | 0.24457925545780757 |

|
||
| 7918 |

SEKA
SEKA
|
$0.00002871 | 0.3% | 1.8% | 5.8% | 25.7% | $75.76 | $28,715.99 | $28,715.99 | 1.0 |

|
||
| 8443 |

Gaia Everworld
GAIA
|
$0.00005386 | 0.0% | 0.7% | 0.4% | 31.8% | $1.11 | $22,755.98 | $26,932.02 | 0.8449413707871535 |

|
||
| 8898 |

Space Nation Oikos
OIK
|
$0.00005431 | 0.0% | 14.8% | 10.1% | 23.3% | $140.36 | $18,832.59 | $54,312.50 | 0.346745 |

|
||
| 10525 |

Mist
MIST
|
$0.0001687 | 0.1% | 1.8% | 7.5% | 20.1% | $76.92 | $9,510.02 | $168,746 | 0.05635708820999992 |

|
||
| 11211 |

HAYLORD
HAYLORD
|
$0.057235 | 0.0% | 1.9% | 6.0% | 37.2% | $1.24 | $7,235.30 | $7,235.30 | 1.0 |

|
||
| 11236 |

World Of Claudecraft
WOC
|
$0.057206 | 1.4% | 0.7% | 4.5% | 43.6% | $23.19 | $7,160.31 | $7,160.31 | 1.0 |

|
||
| 12256 |

Puffverse
PFVS
|
$0.00004193 | 0.0% | 0.0% | 9.1% | 6.9% | $20.42 | $4,890.30 | $41,932.79 | 0.11662222199999998 |

|
||
| 12935 |

Valora
VALORA
|
$0.054063 | 0.0% | 0.9% | 13.8% | 41.9% | $2.04 | $3,772.89 | $4,043.75 | 0.9330156783642821 |

|
||
| 13394 |

VOXIE
VOXIE
|
$0.053331 | 0.0% | 10.3% | 20.2% | 78.8% | $4.19 | $3,116.85 | $3,116.85 | 1.0 |
|
||
| 13818 |

Senkai
SENKAI
|
$0.052631 | 0.0% | 0.7% | 19.5% | 27.9% | $13.08 | $2,631.32 | $2,631.32 | 1.0 |

|
||
| 14281 |

Rustfall
RUST
|
$0.052180 | 0.0% | 6.5% | 11.9% | 30.3% | $2.55 | $2,110.71 | $2,110.71 | 1.0 |

|
||
| 14802 |

Metaverser
MTVT
|
$0.068483 | 0.0% | 2.3% | 2.3% | 77.9% | $15.24 | $638.12 | $855.74 | 0.7456915101234044 |

|
||

Lumox Studio
LUMOX
|
$0.00 | - | - | - | - | - | - | - |

|
||||

Chronyx Studios
CHX
|
$0.00 | - | - | - | - | - | - | - |

|
||||
Showing 1 to 43 of 43 results
Rows
Top MMO Coins Market Cap Chart
The chart below shows the market capitalization and dominance across top MMO including Big Time, World of Dypians, Alien Worlds and others over a period of time.
Top MMO Coins Performance Chart
The chart below shows the relative performance of top MMO coins over time, tracking their percentage gains and losses in-terms of price across different time periods.
MMO Latest News


 2
 1
 APPLE
 MIST

 4
 FOUR
 C
 API
 COULD
Articles related to MMO

Reviews
Top 10 NFT Games to Check Out in Q2 2024
Joel Agbo



Web3 Games
MCH Verse: Revolutionizing Web3 Game Growth with Data Analytics
Footprint Analytics
5.0 (4 votes)


 Or check it out in the app stores


