Building a cryptocurrency portfolio dashboard is a great way to start learning more about this emerging financial market. Like any other investment, it is also subject to a certain degree of risk. Therefore, once a portfolio has been created, it becomes important to continuously keep track of its growth. In addition to visualizing trends over time, calculating returns in periodic intervals also helps fine-tune trading strategies and make market entry and exit decisions.
In today's article, we will explore how to build a crypto portfolio dashboard using Observable Framework and Python. It will provide a comprehensive breakdown of absolute and relative price change along with clear indicators to calculate returns. Since crypto markets trade 24/7, we will also set up automation using GitHub Actions to update the dashboard regularly.
Here’s a live preview of how the dashboard will eventually look like, and you can access the Github repository here. Let's dive in!
Prerequisites
In addition to Python 3, we will need to set up Observable Framework which is a Node.js application. Make sure to install Node.js version 18 or later. It’s also recommended to install yarn as the package manager.
npm install --global yarn
Installed versions of different packages can be verified as shown below:
node --version
npm --version
yarn --version
Since the dashboard will be hosted as a GitHub page, and makes use of GitHub Actions for automation, a personal GitHub account is also needed.
The above endpoint can be accessed for free, but requires keyed authentication. All you need to do is sign up and create a Demo account. The key can then be generated using the Developer's Dashboard. In this guide, we will be making use of a Pro API key, which unlocks higher rate limits.
Creating a New Project on Observable Framework
We will begin by creating the folder structure for our dashboard. The frontend takes care of how the dashboard looks like, and will be based on JavaScript. The backend is responsible for fetching the historical price data from CoinGecko, and will make use of Python. To create a new project, run:
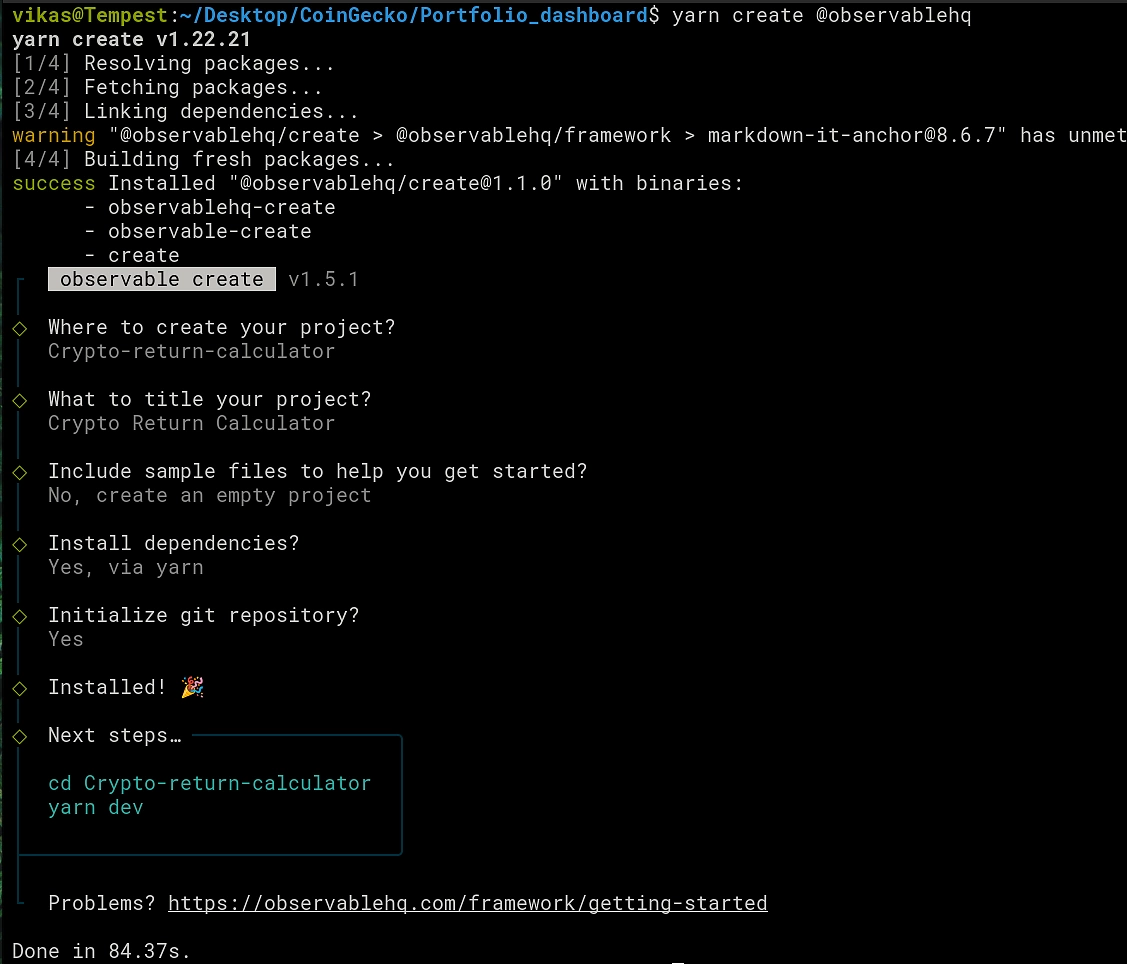
yarn create @observablehq
Now, a series of prompts will appear, which can be answered based on user preferences. Note that we have selected yarn as the preferred package manager and also initialized a git repository.
The docs folder will contain code for both the front and backend. In our case, the Python backend will be used to make API calls to CoinGecko and fetch historical price data for a given asset. This is also called a data loader, which will then be used by the dashboard frontend. Within docs, we can create another folder data to store all the Python code. It will further help to organize the code in separate files for better readability as shown in the next sections.
How to Fetch Historical Coin Price Data using an API?
In the file api.py, we define the following function to read the API key locally from a file or from an environment variable. The latter is relevant when setting up automation using GitHub Actions, and will be discussed in detail later.
We now define another function which will be used to process the API request. Response code 200 indicates that the request was successful.
Finally, the appropriate URL is used to fetch historical price data for a specified duration (number of days), for a given currency and up to a certain precision. Further details regarding this endpoint can be found in the API docs.
The input parameters to the above function along with a set of dummy portfolio details are added to a separate portfolio.py file. Historical data will be fetched for a duration of 120 days with euro as the target currency.
# Number of days
duration = "120"
target_currency = "eur"
# Define portfolio
port_curr = ["bitcoin", "ethereum", "chainlink", "dash", "litecoin"]
port_amount = [0.10, 1.5, 300, 75, 50]
How to set up the Python Data Loader?
The data loader is essentially a Python script (value.json.py) which does the following:
-
Fetches the historical price data for a given coin id and a specified duration
-
Creates a breakdown dictionary with daily value (daily price x portfolio amount)
-
Converts the dictionary to JSON and dumps the data to standard output
The API call returns a dictionary, which has time in the form of UNIX epoch. To convert it into the datetime format, we can make use of the following transformation:
Additionally, we would like to gather price data for all assets, and store it into a list of dictionaries. Such a data structure can be created by initializing with zeros.
How to Set up Your Crypto Portfolio Dashboard
The pages for the dashboard are grouped into markdown files, where special code blocks can be used to execute JavaScript code. The home page content is specified in the index.md file. Additionally, we will create two more pages with the following idea:
-
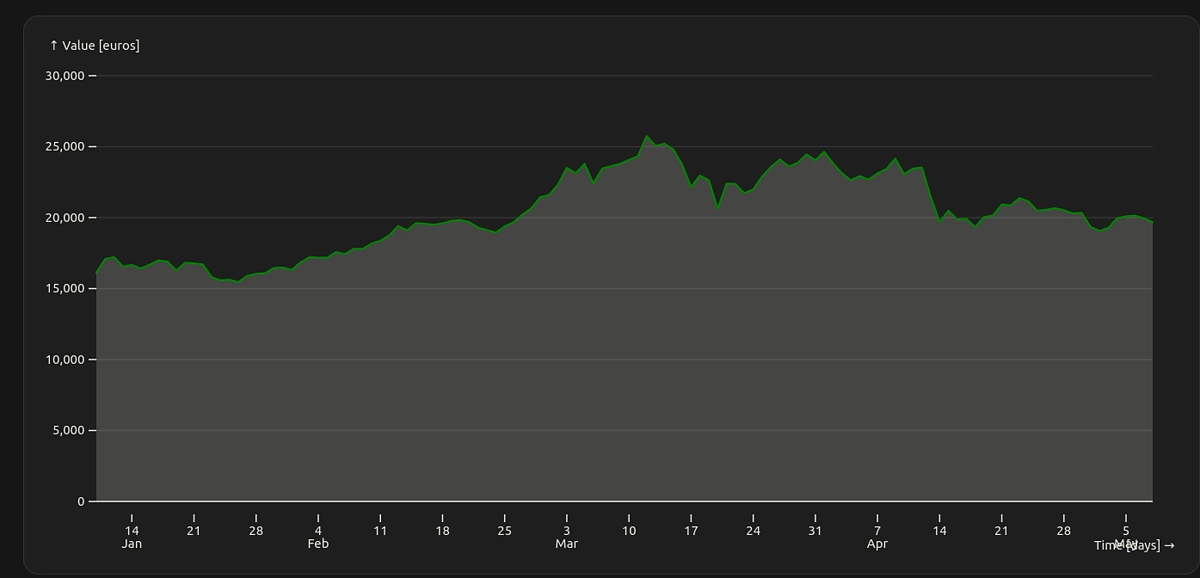
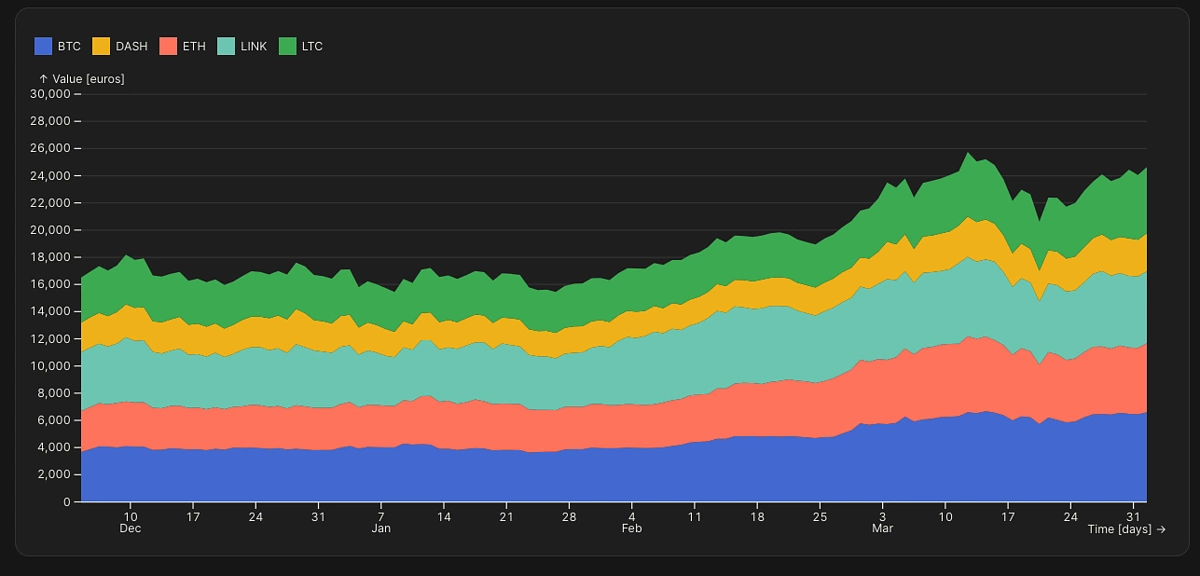
value.md - Shows change in total value (euros) of the portfolio along with individual breakdowns
-
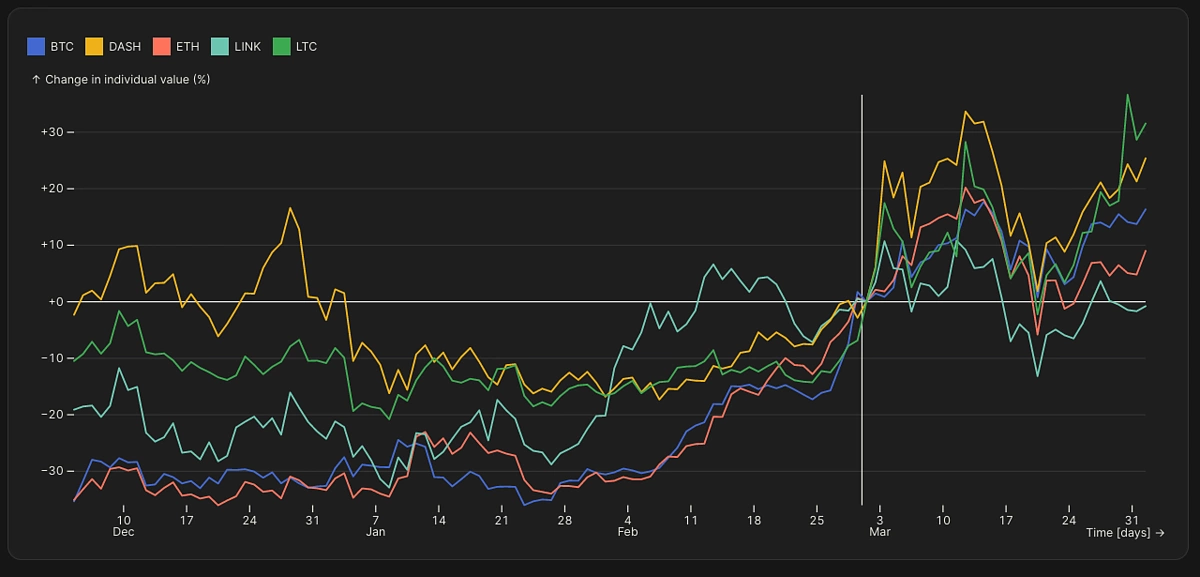
change.md - Shows relative change (in %) between different cryptocurrencies with an interactive date selection feature
Similar to our Python backend, we can also organize the front end code in separate files to enable reuse and enhance readability. The plotting functions are grouped in the components/plots.js file. For the first page, we want to make a line + area plot to track total value change in our portfolio. This can be achieved using the fantastic Observable Plot library.
Similarly, it helps to also visualize changes in the individual assets within the portfolio since there can be a situation where some of them stay the same or decrease in value over time. A stacked bar plot is therefore a neat way to gain more insights into the performance of the individual assets.
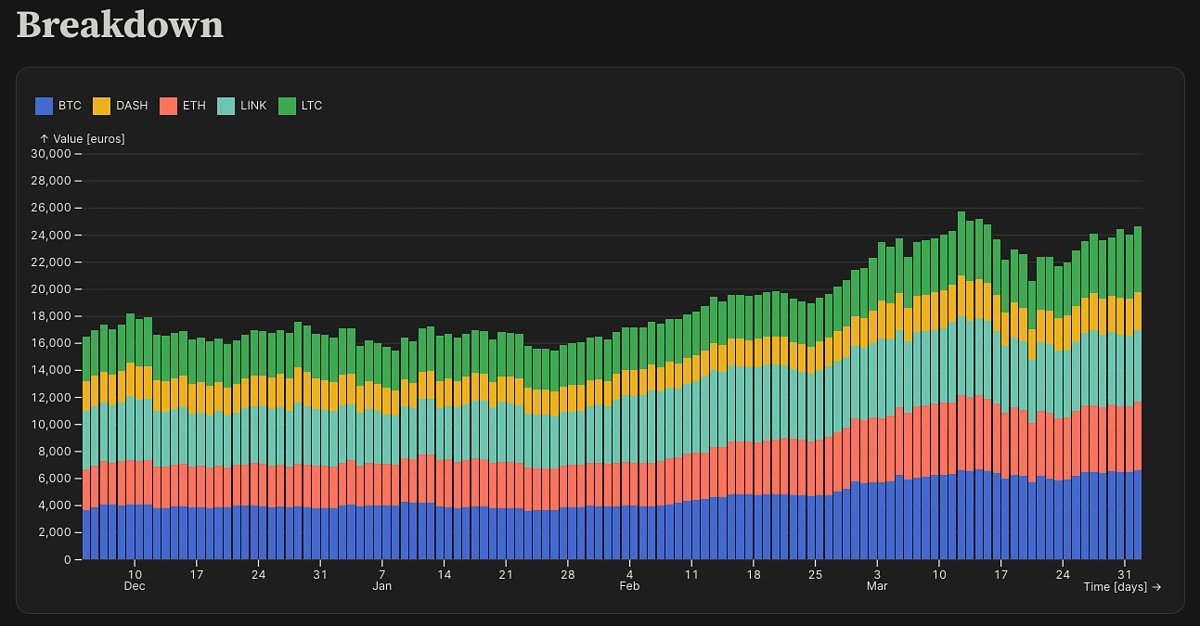
A stacked area plot shows the same information, but can be more visually appealing.
To give the user better perspective on the magnitude of the portfolio changes, we can also add two cards on the top row, one displaying the % change over last 7 days, while the other for last 30 days.
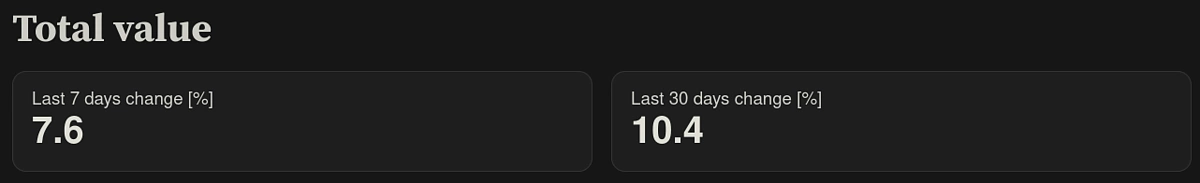
The % change can be easily calculated by making a JavaScript function getPertChange which takes the number of days as an additional input.
Overall layout of the page is controlled via the following code in value.md:
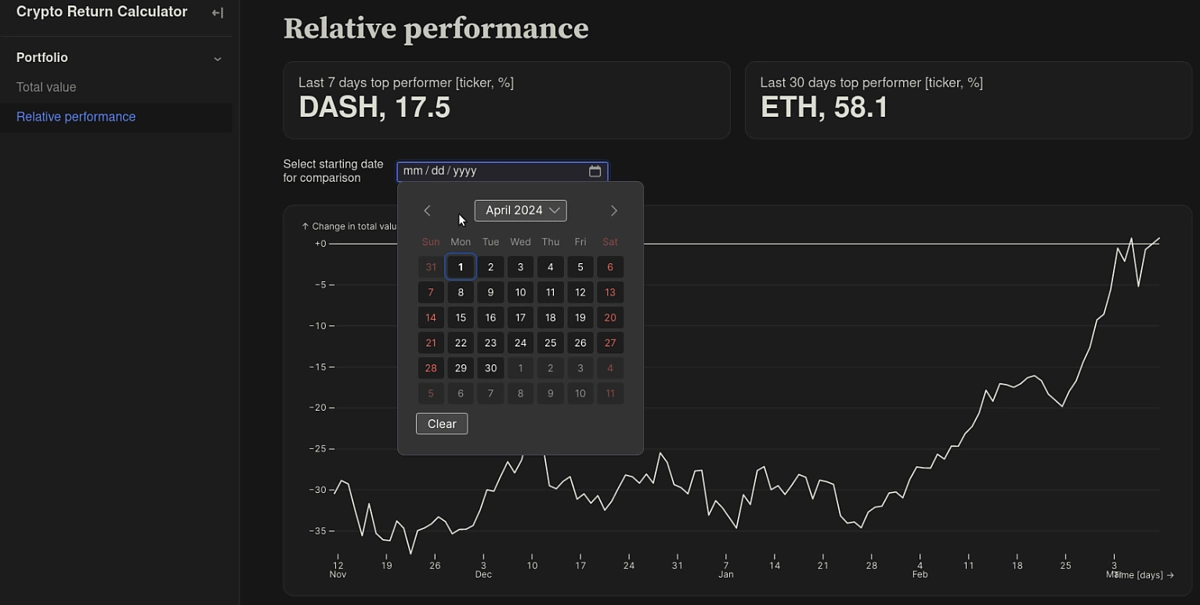
The second page (change.md) shows relative performance when comparing all the assets in the portfolio.
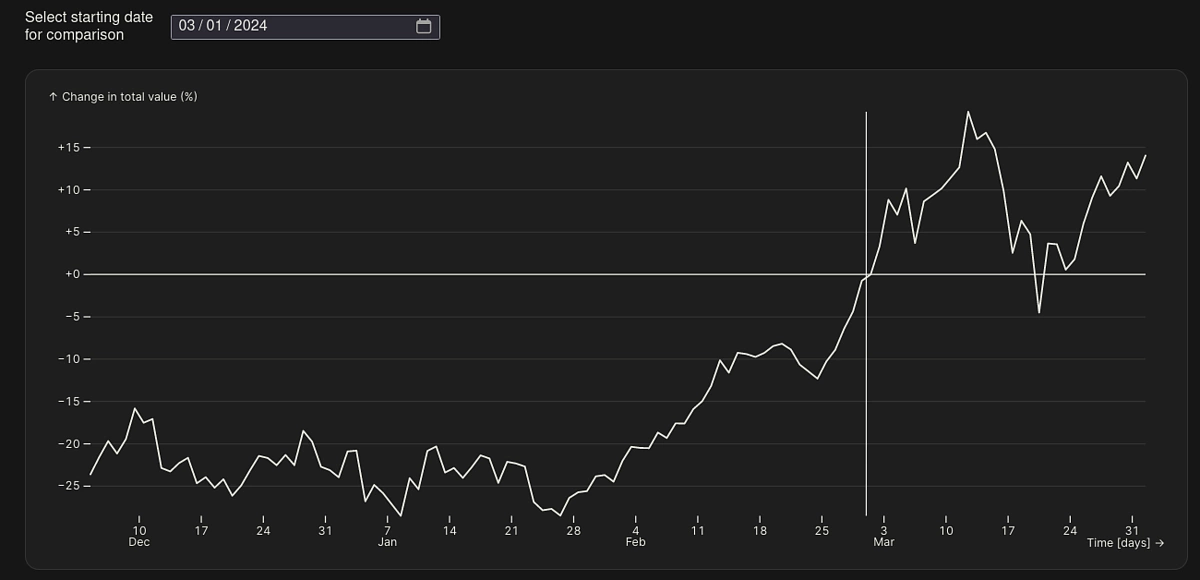
A similar approach can be taken to show the change in total value.
Similar to the first page, it will be useful to add two cards on the top, which shows the top performer (maximum % change in value) over a period of 7 and 30 days.
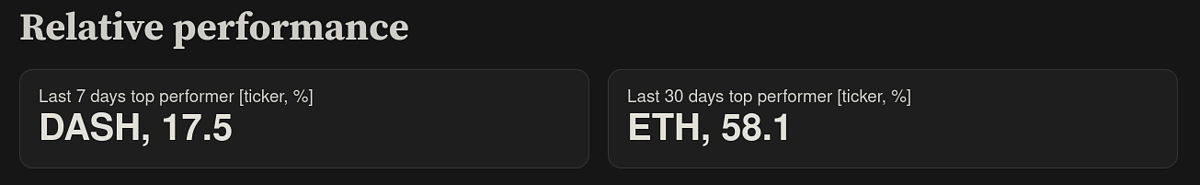 To calculate the top performer, we make use of the following logic:
Additionally, we would like to have an interactive date selection feature, so that we can have different points of origin when comparing the relative performance. This is achieved using the Date interface component available via Observable Inputs.
|
const date = view( |
The overall page layout is controlled via the following logic:
How to Test the Dashboard Locally?
Once both the front and backend code is ready, the dashboard can be built locally to verify that everything works as expected. Observable Framework supports live preview, which means that the in-browser page updates automatically whenever any changes are made. This helps to quickly test the impact of any changes made to the page layout or to the data loaders.
To start the preview server, execute the following:
yarn dev
A browser window should open automatically. If not, then visit the following address: http://127.0.0.1:3000/
How to Deploy the Dashboard to GitHub Pages?
In the previous section, we managed to generate the dashboard locally.
As you might also want to check on your portfolio when away from your laptop, or on your mobile phone, we will now take a step further and make use of GitHub Actions to automatically deploy our dashboard to our very own GitHub Page – this will make it accessible across all devices.
We can even set a schedule at which the dashboard should be updated, which ensures that the impact of any sudden price movement becomes immediately visible to us.
The Observable project was initialized as a Git repository in the beginning. This can now be pushed to GitHub, as is also done for the code in this article. Now we need to enable deployment for Pages. Navigate to Settings > Pages > Build and Deployment > Source (select GitHub Actions).
The CoinGecko API key should be saved as a repository secret: Settings > Secrets and variables > Actions > Secrets > Repository secrets > New repository secret.
The next step is to create a workflow file that will be used to build and deploy the dashboard. The file contains one or more jobs, which are essentially a sequence of steps describing how we want to create the software environment and build the dashboard. We need to ensure that all dependencies (Node.js and Python) are installed first during the build job. The last step uploads artifacts, which are picked up by the deploy job, which details how the pages should be created.
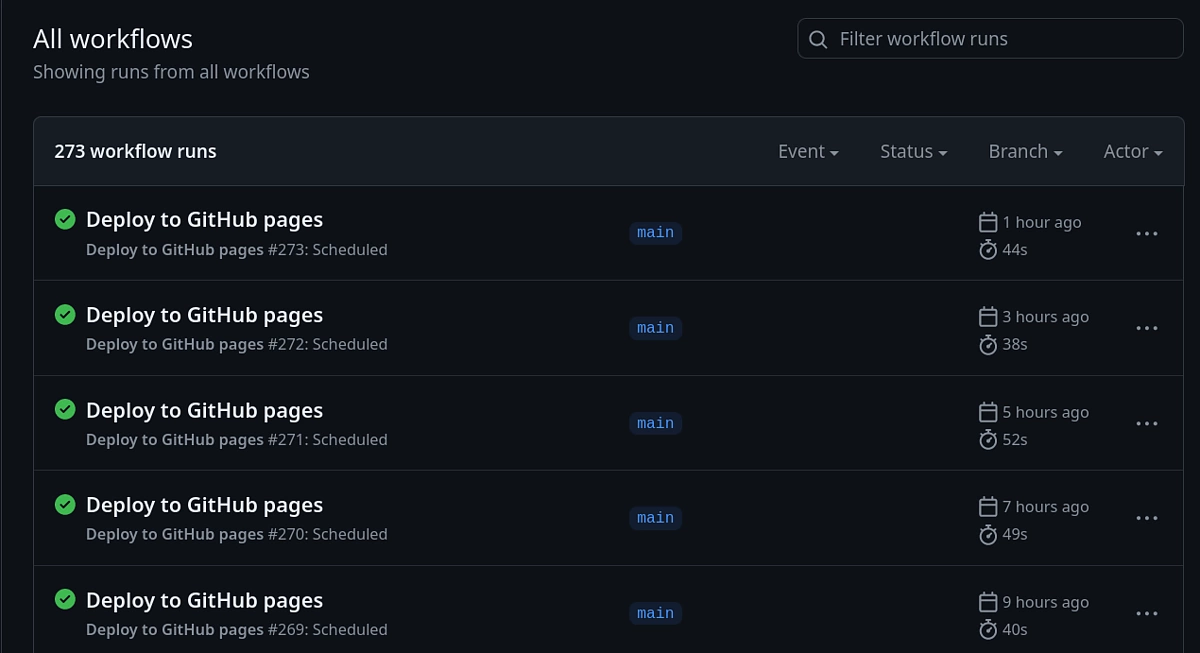
The schedule trigger can be used to set a predefined frequency with which the dashboard will be built and deployed. It makes use of the cron syntax, which can be adapted as per your need. The example above triggers the workflow 30 minutes past an hour, every two hours (02:30, 04:30 etc). Summary of the workflow runs appears in the Actions tab.
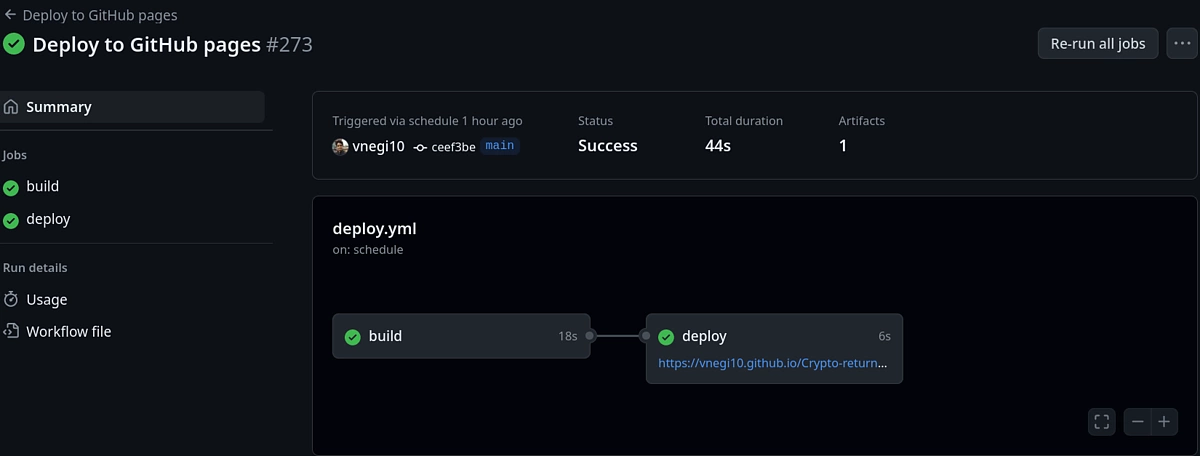
Opening a single workflow result shows a figure with all connected jobs (only two in our case). The URL of the deployed GitHub page is also visible.
To check your portfolio health, you can now bookmark the dashboard URL, and visit it whenever you like!
If you enjoyed this article, you might want to read more about building a DEX tracker with Streamlit and Python.

Subscribe to the CoinGecko Daily Newsletter!


 Or check it out in the app stores